CIENCIAS AGROPECUARIAS-Artículo Científico
ESTIMATING SOIL PROPERTIES WITH MID-INFRARED SPECTROSCOPY
ESTIMACIÓN DE PROPIEDADES DEL SUELO A PARTIR DE ESPECTROSCOPÍA DE INFRARROJO MEDIO
Johana P. Bonett1; Jesús H. Camacho-Tamayo2*; Javier E. Vélez-Sánchez3
1 Ingeniero Agrícola, M.Sc. Universidad Nacional de Colombia, carrera 30 No. 45-03, Bogotá, e-mail: johanabonett@gmail.com
2 Ingeniero Agrícola, M.Sc. Ph.D., Profesor Asociado, Facultad de Ingeniería, Programa de Ingeniería Agrícola. Universidad Nacional de Colombia, carrera 45 No. 45-03, Bogotá, e-mail: jhcamachot@unal.edu.co*Autor para correspondencia
3 Ingeniero Agrícola, M.Sc., Ph.D., Profesor Asociado, Facultad de Ingeniería, Programa de Ingeniería Agrícola. Universidad Nacional de Colombia, Bogotá, e-mail: jevelezs@unal.edu.co
Rev. U.D.C.A. Act. & Div. Cient. 19(1): 55-66, Enero-Junio, 2016
SUMMARY
The mid-infrared technique (MIR) can be used to identify and estimate soil properties with high accuracy. The aim of this study was to evaluate the potential of mid-infrared reflectance spectroscopy (MIR) for the estimation of chemical properties of soils as well as the application of this technique in obtaining digital maps. In this study, 249 soil samples from two orders, Andisols and Oxisols, were analyzed. The results obtained in the analysis of the curves verified that the greater number of attributes was reflected in the spectral region of 400 and 850cm-1. The Andisols stood out due to the results in the calibration of the models, which were better than those of the Oxisols. The spectral responses were similar in both soils, but with different levels of reflectivity. This difference was more notable in the Andisols, where the spectral peaks were lower, a fact attributable to the compounds of the organic matter that tended to obscure the soil, absorbing infrared light. The results demonstrated that the mid-infrared reflectance spectroscopy MIR allowed for the processing of a large number of samples, where information about various parameters was obtained in a single spectrum. The organic carbon was the attribute with the best prediction. Similarly, the semivariogram models and contour maps obtained from the spectral data models showed high similarity to those obtained from the laboratory measurements for those properties, where the spectral models were representative.
Key words: Diffuse reflectance, pedometrics, soil analysis, predictive models, spatial variability.
RESUMEN
La técnica de infrarrojo medio (MIR) puede ser utilizada para identificar y para estimar las propiedades de suelos, con gran precisión. El objetivo del presente estudio fue evaluar el potencial de la espectroscopia de reflectancia en el infrarrojo medio (MIR), para la estimación de algunas propiedades químicas del suelo, así como la aplicación de esta técnica, en la obtención de mapas digitales. Fueron analizadas 249 muestras de suelos de dos órdenes, correspondiente a Andisoles y Oxisoles. Los resultados obtenidos en el análisis de las curvas permiten verificar que el mayor número de atributos están reflejados en la región espectral de 400 y 850cm-1. El Andisol, se destacó por obtener mejores resultados en la calibración de los modelos que el Oxisol. Las respuestas espectrales en ambos suelos fueron similares, pero con diferentes niveles de reflectancia. Esta diferencia fue más marcada en los Andisoles, donde los picos espectrales fueron más bajos, hecho atribuible a los compuestos de la materia orgánica que tienden a oscurecer el suelo absorbiendo la luz infrarroja. Los resultados demuestran que la espectroscopia de reflectancia infrarroja MIR permite procesar una gran cantidad de muestras, donde se obtiene información sobre varios parámetros en un solo espectro. El carbono orgánico fue el atributo con la mejor predicción. De igual manera, los modelos de semivariograma, como los mapas de contorno, obtenidos a partir de los modelos con datos espectrales, mostraron alta similitud con los obtenidos a partir de las mediciones hechas en laboratorio, para aquellas propiedades, donde los modelos espectrales fueron representativos.
Palabras clave: Reflectancia difusa, pedometría, análisis de suelos, modelos predictivos, variabilidad espacial.
INTRODUCTION
Throughout history, people have used different methods for the quantification of the elements present in soils with laboratory chemical analysis in order to characterize or identify the types of soils and agricultural potential. For the most part, the analysis to determine the chemical properties of a soil is wasteful and slow and requires a high investment, especially when intensive and systematic surveys are conducted to determine the spatial variability and define the management zones (Plant, 2001). Moreover, the reagents used in these analyzes generate waste that may contain reagents or microorganisms that pose a risk to the environment, health and natural resources, due to their corrosive, reactive, explosive, toxic, biological-infectious, and flammable characteristics (Viscarra-Rossel et al. 2006).
There is global consensus to develop cleaner, cheaper and faster methodologies to perform soil analyzes that help, for example, environmental monitoring, as proposed by Okin & Painter (2004) and Shepherd & Walsh (2007) or the modeling of biological processes or agricultural production or production systems known as precision farming or localized handling (Viscarra-Rossel et al. 2006; Tittonell et al. 2008). Among these techniques, there is the perception of soil, which can be done through spectral signatures, obtained by physical processes where a body absorbs energy and reflects part of it. In the case of soils, this absorption depends on the compounds that form them, which reflect energy at different wavelengths.
It is possible to find relationships between the content of certain nutrients in a soil and their spectral responses, which can be identified through models. The functions that result from modeling phenomena for estimating soil properties from auxiliary variables are called pedotransfer functions (PTF), proposed by Bouma & Van Lanen (1987), whose objective is the use of data that needs to be processed or transformed into the required data (Bouma, 1989). These PTFs provide information that is usually difficult to obtain, either because of high costs or difficulty in sampling. Also, secondary data can be used, commonly available in soil survey reports or geographic information or otherwise easily obtained (Minasny et al. 2003). Therefore, one purpose of PTF's is decreasing costs and increasing the speed of information collection.
The potential use of diffuse reflectance spectroscopy in agriculture and specifically in the study of soil characteristics and their spatial distribution has been demonstrated by obtaining spectra in the VIS, NIR, MIR (Bilgili et al. 2010; Camacho-Tamayo et al. 2014; Vohland et al. 2014). The novelty of this technology is that a single spectrum can simultaneously characterize various soil properties. Similarly, for decision-making, it is helpful to present information in a way that the soil variability and especially their properties can be properly identified, represented by digital maps. Digital soil mapping (DSM) is defined as the creation and manipulation of spatial information systems applied to soil studies through numerical models for determining the spatial and temporal variations, as well as their properties, based on the observation and knowledge of them and the environmental variables (Behrens et al. 2014).
DSM is characterized by the adoption of new tools and techniques for analyzing, integrating and visualizing soil and environmental data, obtained by remote or close-up observation, or for the use of geostatistical techniques. These tools are essential to streamlining and perfecting soil mapping (Grunwald, 2009).
This study aimed to evaluate the potential of mid-infrared reflectance spectroscopy (MIR) for the estimation of soil chemical properties through the calibration of partial least square regression models, as well as the application of this technique for obtaining digital maps.
MATERIALS AND METHODS
Characterization of the study area. For this study, 90 samples were taken from an Andisol in the municipality of Silvania (Cundinamarca, Colombia) and 160 samples were taken from an Oxisol in the municipality of Puerto López (Meta, Colombia). The samples were air dried and passed through a 2mm sieve to obtain the spectral responses and the pH was determined with a potentiometer and a 1:1 soil/ water ratio; the exchangeable aluminum (Al.I) was revealed with titration; along with phosphorus by the Bray II method; Ca, Mg, K and Na by extraction with ammonium acetate and a 7.0 pH and organic carbon by the method modified of Walkley Black. The spectral responses were obtained with a Prestige 21 sensor (Shimadzu Corporation) that covered a range between 4000 and 400cm-1 of the MIR region.
Processing the spectral responses. Initially, a characterization of the spectral responses of the two types of soils was carried out to identify the similarities and differences. In addition, the correlation of the properties was analyzed at different wavelengths of the spectral response, along with the amplitude correlation, from the sum of the maximum and minimum absolute values of the observed linear correlation.
Calibration of the models. The spectral model calibration was performed using partial least squares regression (PLSR) (Wold et al. 2001), widely used in chemometrics procedures that provide a better approach of quantitative models between predictor variables (X) and responses ( Y), featuring higher performance than multiple linear regression (MLR).
In the calibration, the coefficient of determination (R2), the root mean square error of prediction (RMSE) and the residual deviation from the prediction (RPD) were evaluated. These calibration parameters served as the basis for indicating the models that performed better and were obtained with ParLeS, developed by Viscarra-Rosel (2008). From these results, descriptive statistics were performed for all of the data of the analyzed attributes using SPSS version 18.0. In this analysis, the mean, median, minimum and maximum values of skewness, kurtosis and coefficient of variation (CV) were determined for each attribute, measured in the laboratory and obtained from the spectral models.
Geostatistical analysis. The spatial variability of the analyzed attributes was determined with geostatistical methods using universal kriging and semivariogram analysis (Bailey & Gatrell, 1998). Based on the fitness of the models, the nugget (C0), the sill (C0 + C), the range (R) and the degree of spatial dependence (DSD) determined as the ratio of the nugget and the sill (C / C0 + C), considered strong for DSD when above 0.75, moderate between 0.25 and 0.75, and weak below 0.25 (Cambardella et al. 1994). The theoretical semivariogram models were estimated using GS+ v.7. For the selection of the semivariogram, different functions were evaluated to choose the best data fit: the spherical, exponential or Gaussian models. The prediction of the kriging attributes resulted in contour maps using Surfer v.10 (Golden Software, CO, USA), based on the observed values and those obtained from the spectral models.
RESULTS AND DISCUSSION
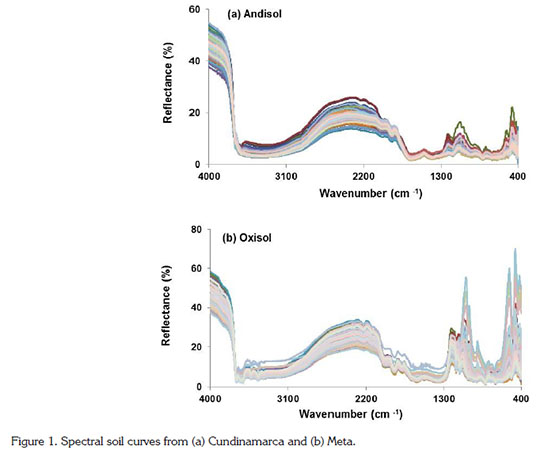
Analysis of the spectral curves. The spectral responses of the Oxisols and Andisols differed mainly in the region of 400 to 2200cm-1 (Figure 1), where the Oxisols showed higher reflectance due to their lower content of organic matter (OM). In general, OM absorbs energy and promotes a lower intensity of reflectance across the spectrum (McDowell et al. 2012). This difference is due to weathering processes in which Oxisols are strongly influenced by climatic factors such as high temperatures and heavy rainfall, while Andisols receive greater influence from the relief, with higher contents of OM and the presence of volcanic ash.

By looking at the spectra for the soil type and identifying where the attributes increased expression, it was verified that the Oxisol presented its maximum reflectance in the spectral region of 466 to 680cm-1, with values up to 69%. According to McDowell et al. (2012), the region of the spectral signature of soils located between 600 and 1500cm-1 is where the majority of characteristics of the fundamental vibrations of silicate minerals in the soil are found. In Oxisols, McDowell et al. (2012) found that the spectral characteristics caused by iron oxides have great particularity because they produce an increase in reflectance at short wavelengths and a decrease in reflectance at slightly longer wavelengths, as can also be verified in Andisols.
High percentages of reflectance are also an effect of reflection of infrared light in the spectral range of light or dark colors. In the analyzed soils, the light emission could be an indicator of the low content of humic acids, responsible for providing dark colored solid that are high in OM. For the Andisol, the curve in the spectral region was smoother than that of the Oxisol, partly due to the higher content of OM. Dark colors in soils absorb light emitted from the spectrum, which reduces the reflectance percentage, resulting in a narrower curve. The region between 900 and 2000cm-1, according to McDowell et al. (2012), may be ambiguous due to overlapping attributes, such as organic compounds, carboxyl, amide and CH groups, as well as common minerals of quartz and kaolinite silicates.
Correlation between the attributes and the spectral response. In the analysis of the correlations, the Al in the Andisol presented a positive correlation in most of the spectral region, with increased expression with a correlation of 0.68 in the spectral region of 3502cm-1. For the Oxisol, lower correlation values (Figure 2) were observed. Correlations with amplitude values close to one (1) indicate that the spectral response can be used as an alternative to estimate the contents of an element, as seen for Al in the Andisol, whose amplitude was 0.78.
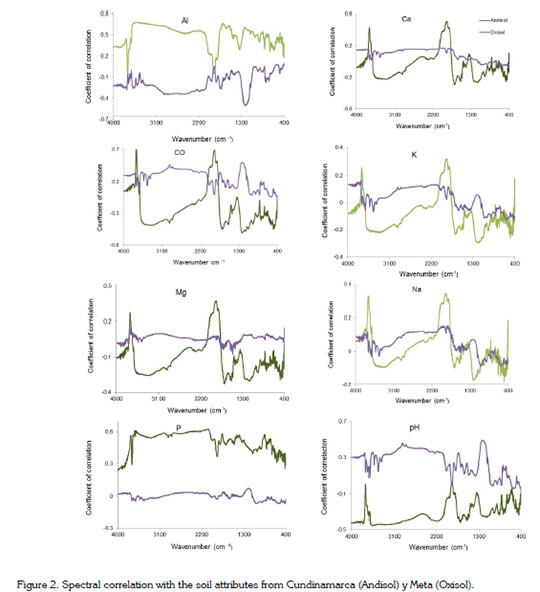
In the analysis of the correlations for exchangeable bases Ca, K, Mg and Na, a similar behavior was found in both soils, where the spectral response obtained in the Andisol had a broader amplitude than the Oxisol. For these attributes, the Andisol presented a negative correlation in most of the spectrum and a positive one in some points. The highest peak in the spectral region was at 1850cm-1, with values from 0.26 for K to 0.48 for Ca, an attribute that presented a range of 0.80, a figure that suggests that the spectral model presented a better performance in estimating this property. In turn, the Na had a lower amplitude, with a value of 0.52, influenced by factors that are not readily detected in the spectral response obtained in the MIR, a behavior due to low levels of exchangeable Na and their variability in the landscape and Na levels in the external soil solution, among others (Dunn et al. 2002).
The contents of Mg and K presented an intermediate behavior with amplitudes of 0.68 and 0.60. According to Garzón et al. (2010), for these soils, the contents of K are most affected by the anthropic management, which can cause a loss of this attribute, reflecting a lower amplitude.
The Ca, K, Mg and Na in the Oxisol presented a low amplitude. Often, the spectral response in these soils presented a smooth and low expression. The lower amplitude curve observed for these attributes may decrease the accuracy in the estimating model, which has been attributed to low fertility and, therefore, low attributes. This reaction was expected because, in the sand and clay fraction of Oxisols, the predominant minerals are quartz and kaolinite, low indicators of potential soil fertility (Peña et al. 2009).
The OC had a correlation with a negative pattern less than -0.8 in the region of 1658cm-1 for the Andisol. There was a positive correlation for the Oxisol and part of the curve for the Andisol, close to 0.6 in the regions of 1168 and 3693cm-1, respectively. Considering the soil orders, the Andisol had a higher amplitude than the Oxisol, with values of 1.30 and 0.55, respectively. According to Bellon-Maurel & McBratney (2011), carbonates are easy to find with MIR due to strong absorption bands. The higher contents of OC in the Andisol favored obtaining a better estimation model for this attribute.
In the Oxisol, the OM contents were low and the spectrum curve was flatter, indicating a lower expression of this attribute, despite having a direct correlation. The Oxisols could have this characteristic of identification due to the low OM contents in the correlation curve in the spectral region (Daza et al. 2006).
The P demonstrated a contrary correlation, where the Oxisol presented negative correlations. On the other hand, the Andisol had a positive correlation throughout the curve, higher than 0.5 with a positive correlation of 0.86 in the spectral region of 2054cm-1.
In the analysis of the curve amplitude, the P in the Andisol had the greater amplitude, 0.52, while for the Oxisol it was 0.07. It is worth mentioning that the analyzed soils presented agricultural intervention and that the broadest amplitude was associated with the higher contents of this attribute. Therefore, the wide amplitude observed in the correlation of P was mainly due to the phosphoric fertilization of crops and the presence of P in volcanic ash, which is released in the soil solution, allowing corrections in the pH (Muñoz et al. 2006).
The pH in the Andisol had a -0.3 inverse correlation up to the region of 1747cm-1, where it started to show a positive correlation. For the Oxisol, this property had a higher positive correlation of 0.5. By analyzing the amplitude of this attribute for these soils, the Oxisol presented a range of 0.55, being greater than the amplitude of the Andisol, whose value was 0.48. In general, one can say that these curves allowed for a similar estimation for this attribute from spectral models.
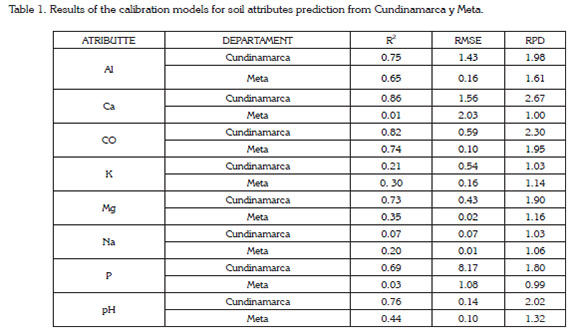
Calibration of the models. The models obtained for the Andisol were generally acceptable, where the outstanding attributes were OC (R2 = 0.82, RPD> 2.3) and P (R2 = 0.69, RPD> 1.8) (Table 1). In general, the soil OC always presented good models for estimating this attribute from the spectral responses (Camacho-Tamayo et al. 2014; McDowell et al. 2012). For the Oxisol, the models showed lower quality for different attributes, where the contents of OC and Al had a good response, with values of R2 = 0.74 and RPD> 1.95; R2 = 0.65; RPD> 1.61, respectively. The other attributes did not indicate a good estimation from the models. These results are consistent with the correlations because the Oxisol was less reliable in the calibration models, coinciding with the report by Reeves et al. (2006).
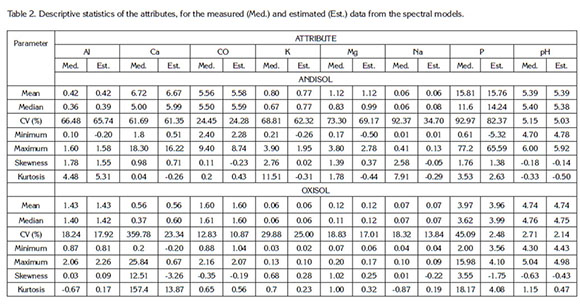
Descriptive statistics. Once the models were calibrated and validated, the localization and dispersion measurements of the data recorded in the laboratory and those estimated with the models (Table 2) were verified, where a similarity between the measurements and estimations was observed for the different attributes with similar mean, median, coefficient of variation (CV), skewness and kurtosis values. This similarity was higher for the OC, Al and pH for the Andisol and Oxisol due to the better model, as compared to the results obtained for the other attributes, whose spectral models were slightly representative, with the exception of Ca, Mg and P for the Andisol. On the other hand, the attributes that resulted in good models also presented a similar behavior in the statistical description, estimated with the models.
In performing the analysis through the MIR spectroscopy, the soil properties demonstrated different levels of reflectivity in similar spectral regions. This difference was more notable in the Andisol, where the spectral peaks were lower, a fact attributable to the compounds of the OM, which tended to obscure the soil, absorbing the infrared light.
Geostatistical analysis. For the Andisol, the Al, Ca, CO, estimated K, Mg, estimated Na, measured P and pH were fit to the exponential model. The measured K and measured Na were fit to a Gaussian model and finally the estimated P was fit to the spherical model. In all of the attributes, the ranges were different (Table 3). These results are similar to those reported by Esfandiarpoor et al. (2010).
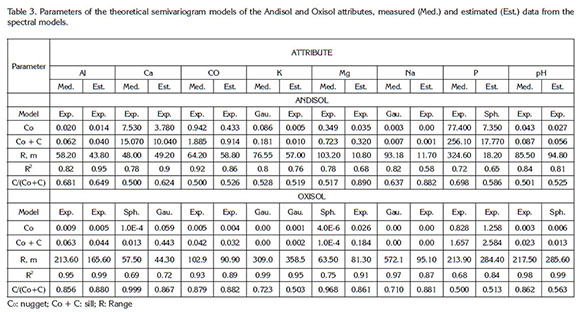
The spatial dependence in all of the analyzed attributes was moderate to strong. The Al, Ca, CO, K, Mg, Na, P and pH presented a moderate spatial dependence and the estimated Mg and Na had a strong spatial dependence, a similar behavior in studies by Jaramillo (2009) for soils with andic properties in Colombia. The moderate spatial dependence in most of the attributes may indicate that these soils still retain their edaphic-genetic variability, which comes from factors such as slope, relief and rainfall, among others, although these soils are used for agricultural activities. The R2 for most of the attributes was greater than 0.70, which may indicate good accuracy of attributes with kriging (Table 3).
For the Oxisol, the exponential and Gaussian models presented a better fit. For the Al, OC, estimated Mg, estimated Na, P and measured pH, an exponential model was used and, for the Ca, K, measured Mg, and measured Na, spherical and Gaussian models were used (Table 3).
For the K, measured Na, measured P, and estimated pH, there was moderate dependence and, for the rest of the analyzed attributes in the soils from Meta, there was a strong spatial dependence, as reported for the region by Camacho-Tamayo et al. (2008) and Peña et al. (2009). The R2 of the attributes, as also reported by Martins et al. (2011), was above 0.80, except for the Ca, measured Mg, and measured P, which had R2 values of 0.69, 0.72, 0.75 and 0.68, respectively. For the attributes with moderate spatial dependence, it could be concluded that the kriging estimation would have less precision, as established by Parfitt et al. (2009).
Contour maps. In figure 3, the Al is distributed with the higher values in the left part of the study area, which corresponds to the higher land, but represents a low percentage of the study area. In general, the majority of the studied land presented values lower than 0.35cmolc kg-1, located on the right and central areas of the studied land on both the maps for the estimated and the measured values.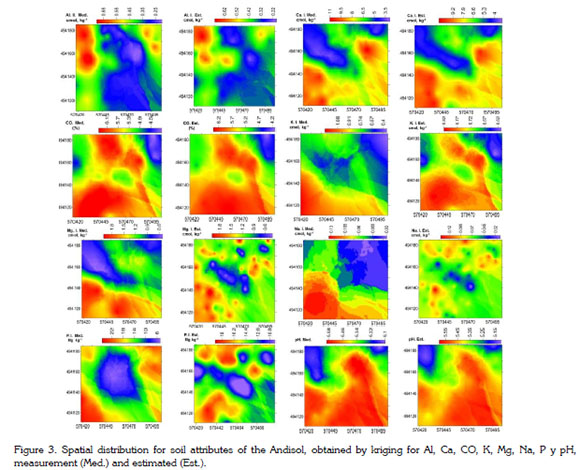
For the Ca, the spatial distribution was given by the higher percentage of the contents of 5.0cmolc kg-1, located in the upper-left area of the land, and in the higher contents of around 9.5cmolc kg-1, located in the lower-left side of the land, and that decreased toward the right in both maps for the estimated and measured values. The OC in the Andisol had a spatial distribution dominated by the high contents because the values above 6% occupied the higher percentage of the land, mainly in the map of the estimated values. This behavior was expected for this attribute because, in the models obtained for the OC, it presented good estimated. The K had a spatial distribution that was similar to that of the OC, where the contents over 0.82cmolc kg-1 occupied the higher percentage and were located in the lower-left part of the land.
Attributes such as the Mg and Na did not have good estimation models; for this reason, there is a difference between the maps obtained with the measured vales and the maps obtained with the estimated values, resulting from diffusion, spatial distribution. In the analysis of the contour maps for P, there were medium to low contents, with values below 14mg kg-1 and distribution in the center of the map.
The prevailing pH values were 5.5, located at the bottom of the map. When the analysis was carried out, these contents did not vary too much, in a range where the solubility of some attributes was favored, but affecting the others. According to Camacho-Tamayo et al. (2008), areas with lower pHs have lower concentrations of Ca and Mg and, therefore, a predominance of low levels of certain bases in the soil.
In the contour maps of the Oxisol, there were different spatial trends for some attributes, where the spectral models did not show good results, contributing to the quality and representativeness of the spatial distribution maps obtained from these models (Figure 4). The Al had a slightly homogeneous distribution. The higher contents were between 1.4 and 1.7cmolc kg-1, located on the left side of the field. The lower content was between 1 and 1.3cmolc kg-1, located on the right side and bottom of the land, and the intermediate contents were in the central area.
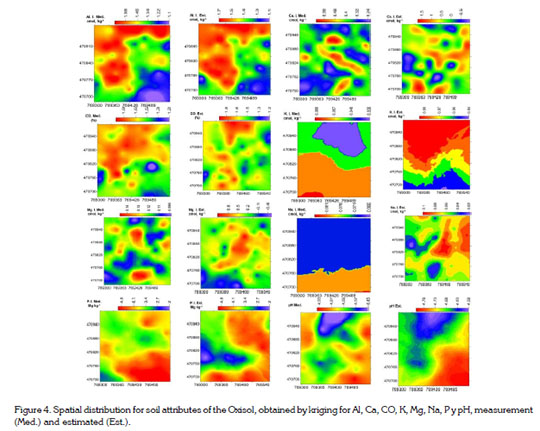
In the analysis of the kriging data interpolation for the pH, the maps had the better fit. The distribution of this attribute was more homogeneous than Al, probably due to the low variability in the content of the soils. On the maps obtained from the measured data as well as the estimated data from the spectral models, the higher pH values were at the bottom of the field, with values between 4.70 and 4.93, with lower ranges at the top, near 4.40. Accordingly, it can be concluded that the upper part of the land had serious acidity problems caused by excesses of Al.
Attributes such as exchangeable bases, Na and P did not show good results. This was expected since these attributes presented low contents in the soil and the resulting spectral models were unrepresentative, thereby generating inadequate estimations. This effect was particularly noticeable in the Oxisols, soils with a low cation exchange capacity (Camacho-Tamayo et al. 2008).
In analyzing the behavior of the maps, the existence of spatial variability of the soil attributes was confirmed, which provided the ability to identify areas that need amendments (Orjuela-Matta et al. 2012), resulting in a way to improve soil use, reducing production costs and environmental pollution (Martins et al. 2011).
Similarly, the results of this study demonstrate that, through the mid-infrared reflectance spectroscopy MIR technique, large amounts of samples can be processed, which can provide information for several parameters in one spectrum. In addition, the integration of the laboratory techniques and mathematical modeling based on MIR spectral responses can be successfully performed for the analysis of soil attributes. With the geostatistical analysis, it was concluded that most of the attributes fit to the exponential and spherical models. The analysis of the semivariograms showed that these attributes presented spatial dependence in both the Andisols and the Oxisols, where those attributes that presented a representative spectrum model provided adequate digital maps based on the values estimated by the models.
Acknowledgements. The authors would like to thank the División de Investigación de la Sede Bogotá of the Universidad Nacional de Colombia for partially financing this study through project Código QUIPU 13140. Conflicts of interest: This paper was prepared and revised with the participation of all of the authors who declare that there are no conflicts of interest that would negatively affect the validity of these results.
BIBLIOGRAPHY
1. BAILEY, T.C.; GATRELL, A.C. 1998. Interactive Spatial Data Analysis. Harlow, UK: Longman. 413p.
2. BELLON-MAUREL, V.; McBRATNEY, A. 2011. Nearinfrared (NIR) and mid-infrared (MIR) spectroscopic techniques for assessing the amount of carbon stock in soils - Critical review and research perspectives. Soil Biol. Biochem. 43(7):1398-1410.
3. BEHRENS, T.; SCHMIDT, K.; RAMÍREZ-LÓPEZ, L.; GALLANT, J.; ZHU, A.; SCHOLTEN, T. 2014. Hyperscale digital soil mapping and soil formation analysis. Geoderma 213:578-588.
4. BILGILI, A.V.; ES, H.M.; AKBAS, F.; DURAK, A.; HIVELY, W.D. 2010. Visible-near infrared reflectance spectroscopy for assessment of soil properties in a semi-arid area of Turkey. J. Arid Environ. 74(2):229-238.
5. BOUMA, J. 1989. Using soil survey data for quantitative le evaluation. Adv. Soil Sci. 9:177-213.
6. BOUMA, J.; Van LANEN, H.A.J. 1987. Transfer functions and threshold values: from soil characteristics to le qualities. In: International Workshop on Quantified le Evaluation Procedures, 1987, Washington. Proceedings. Washington. ITC Publ. p.106-110.
7. CAMACHO-TAMAYO, J.H.; RUBIANO S., Y.; HURTADO S., M.P. 2014. Near-infrared (NIR) diffuse reflectance spectroscopy for the prediction of carbon and nitrogen in an Oxisol. Agr. Col. 32(1):86-94.
8. CAMACHO-TAMAYO, J.H.; LUENGAS, C.A.; LEIVA, F.R. 2008. Effect of agricultural intervention on the spatial variability of some soils chemical properties in the Eastern Plains of Colombia. Chilean J. Agric. Res. 68(1):42-55.
9. CAMBARDELLA, C.A.; MOORMAM, T.B.; NOVAK, J.M.; PARKIN, T.B.; KARLEN, D.L.; TURCO, R.F.; KONOPKA, A.E. 1994. Field-scale variability of soil properties in Central Iowa Soils. Soil Sci. Soc. Am. J. 58:1501-1511.
10. DAZA, M.C.; ALVAREZ, J.; ROJAS, L. 2006. Efecto de materiales orgánicos e inorgánicos sobre las fracciones de fosforo en un Oxisol de los Llanos orientales Colombianos. Agr. Col. 24(2):326-333.
11. DUNN, B.W.; BEECHER, H.G.; BATTEN, G.D.; CIAVARELLA, S. 2002. The potential of nearinfrared reflectance spectroscopy for soil analysis - a case study from the Riverine Plain of south eastern Australia. Aust. J. Exp. Agric. 42(5):607-614.
12. ESFANDIARPOOR BORUJENI, I.; MOHAMMADI, J.; SALEHI, M.H.; TOOMANIAN, N.; POCH, R.M. 2010. Assessing geopedological soil mapping approach by statistical and geostatistical methods: A case study in the Borujen region, Central Iran. Catena. 82(1):1-14.
13. GARZÓN, C.A.; CORTÉS, C.A.; CAMACHO-TAMAYO, J.H. 2010. Variabilidad espacial de algunas propiedades químicas en un Entisol. Rev. U.D.C.A Act. & Div. Cient. 13(1):87-95.
14. GRUNWALD, S. 2009. Multi-criteria characterization of recent digital soil mapping and modeling approaches. Geoderma. 152(3-4):195-207.
15. JARAMILLO, D. 2009. Variabilidad espacial de las propiedades ándicas de un andisol hidromórfico del Oriente Antioqueño (Colombia). Rev. Fac. Nal. Agr. Medellín 62(1):4907-4921.
16. MARTINS, A.L.S.; MOURA, E.G.; CAMACHO-TAMAYO, J.H. 2011. Evaluation of corn production parameters and their spatial relationship with chemical attributes of the soil. Agr. Col. 29(1):99-106.
17. McDOWELL, M.L.; BRULAND, G.L.; DEENIK, J.L.; GRUNWALD, S.; KNOX, N.M. 2012. Soil total carbon analysis in Hawaiian soils with visible, near-infrared and mid-infrared diffuse reflectance spectroscopy. Geoderma, 189-190:312-320.
18. MINASNY, B.; McBRATNEY, A.; MENDONÇA-SANTOS, M.L.; SANTOS, H.G. 2003. Revisão sobre funções de pedotransferência (PTFs) e novos métodos de predição de classes e atributos do solo. Rio de Janeiro: Embrapa solos. (Série Documentos, 45). 50p.
19. MUÑOZ, J.D.; MARTÍNEZ, J.L.; GIRALDO, R. 2006. Variabilidad espacial de las propiedades edáficas y su relación con el rendimiento en un cultivo de papa (Solanum tuberosum L.). Agr. Col. 24(2):355-366.
20. OKIN, G.S.; PAINTER, T.H. 2004. Effect of grain size on remotely sensed spectral reflectance of sandy desert surfaces. Remote Sens. Environ. 89(3):272-280.
21. ORJUELA-MATTA, H.M.; RUBIANO-SANABRIA, Y.; CAMACHO-TAMAYO, J.H. 2012. Spatial analysis of infiltration in an oxisol of the eastern plains of Colombia. Chilean J. Agric. Res. 72(3):404-410.
22. PARFITT; J.M.B.; TIMM, L.C.; PAULETTO, E.A.; SOUSA, R.O.; CASTILHOS, D.D.; de ÁVILA, C.L.; RECKZIEGEL, N.L. 2009. Spatial variability of the chemical, physical and biological properties in lowland cultivated with irrigated rice. Rev. Bras. Ciênc. Solo. 33(4):819-830.
23. PEÑA, R.; RUBIANO, Y.; PEÑA, A.; CHAVES B. 2009. Variabilidad espacial de los atributos de la capa arable de un inceptisol del piedemonte de la cordillera oriental (Casanare, Colombia). Agr. Col. 27(1):111-120.
24. PLANT, R. 2001. Site-specific management: The application of information technology to crop production. Comp. Electron Agr. 30(1-3):9-29.
25. REEVES, J.B.; FOLLETT, R.F.; McCARTY, G.W.; KIMBLE, J.M. 2006. Can near or mid infrared diffuse reflectance spectroscopy be used to determine soil carbon pools? Soil Sci. Plant Anal. 37(15-20):2307-2325.
26. SHEPHERD, K.D.; WALSH, M.G. 2007. Infrared spectroscopy - enabling an evidence-based diagnostic surveillance approach to agricultural and environmental management in developing countries. J. Near Infrared Spectrosc. 15(1):1-20.
27. TITTONELL, P.; SHEPHERD, K.; VANLAUWE, B.; GILLER, K. 2008. Unravelling the effects of soil and crop management on maize productivity in smallholder agricultural systems of western Kenya: An application of classification and regression tree analysis. Agr. Ecosyst. Environ. 123(1-3):137-150.
28. VISCARRA-ROSSEL, R.A.; WALVOORT, D.J.J.; McBRATNEY, A.B.; JANIK L.J.; SKJEMSTAD J.O. 2006. Visible, near infrared or combined diffuse reflectance spectroscopy for simultaneous assessment of various soil properties. Geoderma. 131(1-2):59-75.
29. VISCARRA-ROSSEL, R.A. 2008. ParLeS: Software for chemometric analysis of spectroscopic data. Chemomet. Intell. Lab. Syst. 90(1):72-83.
30. VOHLAND, M.; LUDWIG, M.; THIELE-BRUHN, S.; LUDWIG, B. 2014. Determination of soil properties with visible to nearand mid-infrared spectroscopy: Effects of spectral variable selection. Geoderma. 223-225:88-96.
31. WOLD, S.; SJÖSTRÖM, M.; ERIKSSON, L. 2001. PLS-regression: la basic tool of chemometrics. Chemomet. Intell. Lab. Syst. 58(2):109-130.
Recibido: Marzo 15 de 2015 Aceptado: Febrero 22 de 2016
Revista U.D.C.A Actualidad & Divulgación Científica por Universidad de Ciencias Aplicadas y Ambientales se distribuye bajo una Licencia Creative Commons Atribución-NoComercial 4.0 Internacional.